Jewish Voters in America
By Dr.Aslam Abdullah
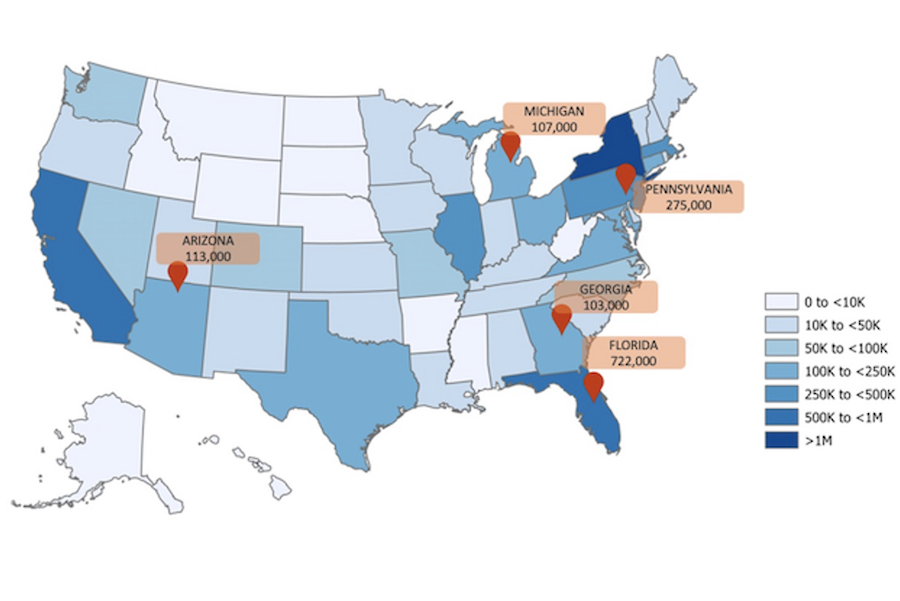
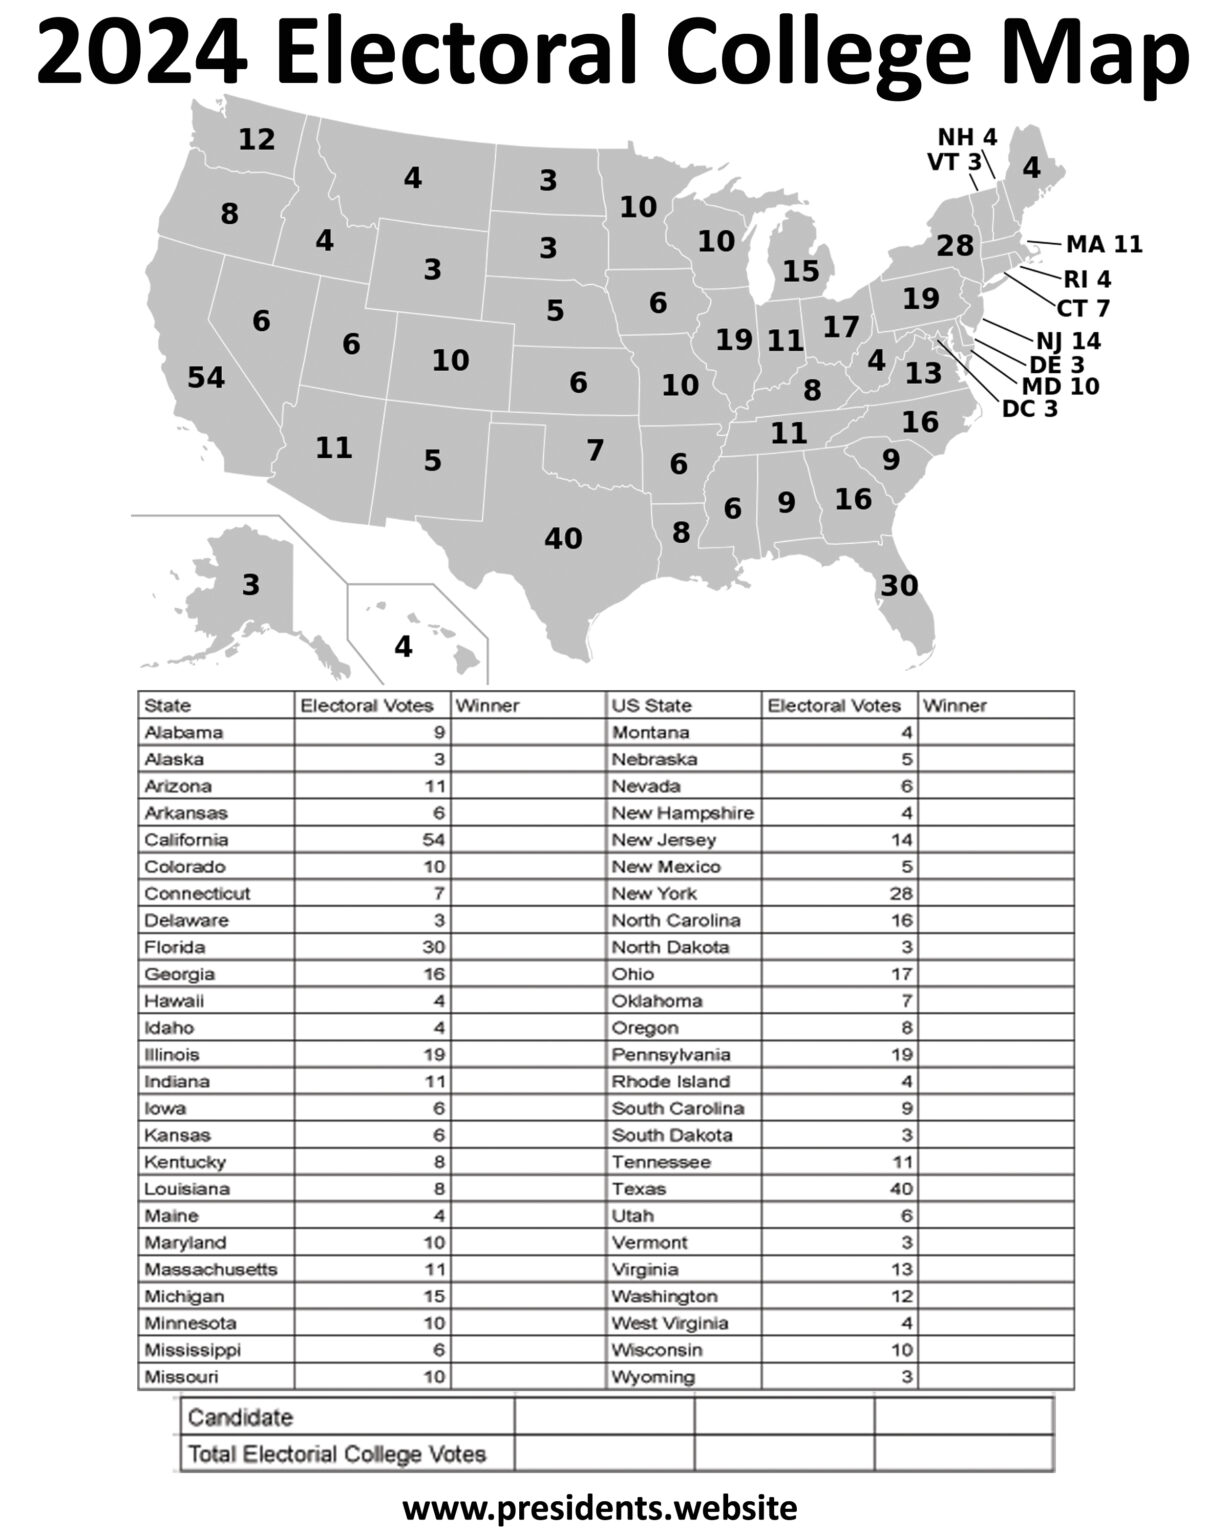
Jews make up the highest percentage of voter turnout of any ethnic group. While 2–2.5% of the United States population is Jewish, 94% live in 13 key electoral college states, which combined have enough electors to elect the president. Though the majority (60–70%) of the country’s Jews identify as Democratic,
American Jewish history began in 1654. In that year, twenty-three Jews – men, women, and children, refugees from Recife, Brazil, which Portugal had just recaptured from Holland -sailed into the Dutch colony of New Amsterdam on a vessel probably named the Sainte Catherine to form a community. The first Jews that came to the New World were Sephardi Jews who arrived in New Amsterdam (New York City). Later, significant settlements of Jews occurred in the port cities of Newport, Philadelphia, Charleston, and Savannah.
In United States politics, Jews have undergone significant shifts in their political positions over time. Many early American German-Jewish immigrants to the United States tended to be politically conservative. Still, the wave of Eastern European Jews, starting in the early 1880s, were generally more liberal or left-wing and eventually became the political majority.
The divide between right and left correlates to the various religious movements among American Jews. The more socially conservative movements in American Judaism (the Orthodox movement and various Haredi sects, though not the Conservative movement) tend to be politically conservative. In contrast, the more socially liberal movements (Conservative, Reform, and Reconstructionist) tend to be more politically liberal or left-leaning.
Several Jewish secular organizations are also at the local, national, and international levels. These organizations often play an essential part in the Jewish community, shaping its structure and dynamics. Most of the largest groups, such as Hadassah and the United Jewish Communities, have an elected leadership. No one secular group represents the entire Jewish community, and there is often significant internal debate among Jews about the stances these organizations take on affairs dealing with the Jewish community as a whole, such as anti-Semitism and policies regarding Israel.
In the United States and Canada today, the mainly secular United Jewish Communities (UJC), formerly known as the United Jewish Appeal (UJA), represents over 150 Jewish Federations and 400 independent communities across North America. Every major American city has its local “Jewish Federation”; many have sophisticated community centers and provide healthcare-related services. They raise record sums of money for philanthropic and humanitarian causes in North America and Israel. Other organizations such as the Anti-Defamation League, American Jewish Congress, American Jewish Committee, American Israel Public Affairs Committee, Zionist Organization of America, Americans for a Safe Israel, B’nai B’rith, and Agudath Israel represent the diverse segments of the American Jewish community on a variety of issues, showcasing the rich tapestry of our community.
Jewish Americans are involved in many important social movements, promoting workers’ rights, civil rights, women’s rights, gay rights, freedom of religion, freedom from religion, peace movements, and other left-wing and progressive causes.
In the late 19th century, Jewish business people were generally conservative Republicans, but they did not mobilize as a separate political faction. The new Yiddish-speaking arrivals in the early 20th century were much more radical.
Since 1968, American Jews have voted about 70–80% for Democrats in Congressional and Senate races; this support increased to 87% for Democratic House candidates during the 2006 elections. Nine Jews are among the 100 U.S. Senators.
As of January 2023, 33 Jews are serving in the 118th Congress, a decrease of one from the 117th. They constitute 6% of that body’s members, three times the 2% of Jews in the general American population.
| State | Number of Jews | Total Population | % Jewish | Electoral Votes |
|---|---|---|---|---|
| New York | 1,795,095 | 19,677,151 | 9.1% | 28 |
| California | 1,239,890 | 39,029,342 | 3.2% | 54 |
| Florida | 672,435 | 22,244,823 | 3.0% | 30 |
| New Jersey | 628,150 | 9,261,699 | 3.0% | 30 |
| Florida | 672,435 | 22,244,823 | 6.8% | 14 |
| Pennsylvania | 433,660 | 12,972,008 | 3.3% | 19 |
| Illinois | 325,260 | 12,582,032 | 2.6% | 19 |
| Massachusetts | 301,880 | 6,981,974 | 4.3% | 11 |
| Maryland | 240,100 | 6,164,660 | 3.9% | 10 |
| Texas | 175,580 | 30,029,572 | 0.6% | 40 |
| Virginia | 150,620 | 8,683,619 | 1.7% | 13 |
| Ohio | 150,335 | 11,756,058 | 1.3% | 17 |
| Georgia | 141,020 | 10,912,876 | 1.3% | 16 |
| Arizona | 123,750 | 7,359,197 | 1.7% | 11 |
| Michigan | 119,905 | 10,034,113 | 1.2% | 15 |
| Connecticut | 118,350 | 3,626,205 | 3.3% | 7 |
| Colorado | 98,400 | 5,839,926 | 1.7% | 10 |
| Nevada | 79,800 | 3,177,772 | 2.5% | 15 |
| Washington | 78,600 | 7,785,786 | 1.0% | 12 |
| Missouri | 68,975 | 6,177,957 | 1.1% | 10 |
| Minnesota | 65,900 | 5,717,184 | 1.2% | 10 |
| Oregon | 59,800 | 4,240,137 | 1.4% | 8 |
| District of Columbia | 57,300 | 671,803 | 8.5% | 3 |
| North Carolina | 48,935 | 10,698,973 | 0.5% | 16 |
| Wisconsin | 33,455 | 5,892,539 | 0.6% | 10 |
| Indiana | 26,045 | 6,833,037 | 0.4% | 11 |
| Tennessee | 22,800 | 7,051,339 | 0.3% | 11 |
| Rhode Island | 18,750 | 1,093,734 | 1.7% | 4 |
| Kentucky | 17,600 | 4,512,310 | 0.4% | 8 |
| Kansas | 17,200 | 2,937,150 | 0.6% | 6 |
| South Carolina | 16,820 | 5,282,634 | 0.3% | 9 |
| Delaware | 16,800 | 1,018,396 | 1.6% | 3 |
| Louisiana | 14,900 | 4,590,241 | 0.3% | 8 |
| New Mexico | 12,625 | 2,113,344 | 0.6% | 5 |
| Maine | 12,550 | 1,385,340 | 0.9% | 4 |
| Alabama | 10,325 | 5,074,296 | 0.2% | 9 |
| New Hampshire | 10,120 | 1,395,231 | 0.7% | 4 |
| Nebraska | 9,350 | 1,967,923 | 0.5% | 5 |
| Vermont | 7,865 | 647,064 | 1.2% | 3 |
| Hawaii | 7,100 | 1,440,196 | 0.5% | 4 |
| Utah | 5,650 | 3,380,800 | 0.2% | 6 |
| Iowa | 5,300 | 733,583 | 0.7% | 3 |
| Oklahoma | 4,425 | 4,019,800 | 0.1% | 7 |
| West Virginia | 2,310 | 1,775,156 | 0.1% | 4 |
| Arkansas | 2,250 | 3,045,637 | 0.1% | 6 |
| Idaho | 2,125 | 1,939,033 | 0.1% | 4 |
| Mississippi | 1,525 | 2,940,057 | 0.1% | 6 |
| Montana | 1,495 | 1,122,867 | 0.1% | 4 |
| Wyoming | 1,350 | 581,381 | 0.2% | 3 |
| North Dakota | 400 | 779,261 | 0.1% | 3 |
| South Dakota | 250 | 909,824 | 0.0% | 3 |
| Total | 7,460,600 | 333,287,557 | 2.2% | 538 |


2024
2,649 views
views
0
comments